
This is the question I’ve been asked most often in the last 6-12 months. It’s a question which I could spend hours giving a non committal answer to. In this and the forthcoming posts, I’ll unpick the key information which will lead to me giving a prediction map on Tuesday night (which I’m sure will lead to derision and mockery on Wednesday morning!).
Before we talk about the current state of affairs, it is absolutely worthwhile unpicking the key factors and issues from 2016 to enable a clearer view of the 2020 race. There are plenty of these but I’ll focus on those which are most relevant to this year’s race. Before running through these, I’ll run through how the US elects presidents.
The Electoral College
Voters in the US do not directly elect their president – this is instead done by a group of 538 electors: the electoral college. When the public votes for a candidate, the winner of the state gains the votes of that state’s electors (there are two exceptions to this: Nebraska and Maine). The number of electors varies based on the population of the state – the number of electors for each state is shown in the map below. There is a minimum of three electors per state (including an additional three for Washington D.C.) up to 55 for California – the most populous state. In order for a candidate to win the election, they must secure the votes of 270 electors – this makes swing states incredibly important as despite not having a large population they can give a candidate the electoral votes they need to reach 270.

This process of electing a president leads to some unexpected outcomes. The most significant of these is that a president can be elected whilst losing the popular vote by a significant margin. This is what happened in 2016 – Clinton won the popular vote nationally by over 2.5 million votes yet lost the electoral college. This was due to her racking up huge margins of victory in states like California – something called the ‘efficiency gap’. This is a phenomenon that has become commonplace – Democrats have won the popular vote in 6 of the last 7 general elections but their candidate has been victorious on only 4 of these occasions. The number of electors available leads to certain states being seen as key states or ‘tipping points’ in the race and, subsequently, they often receive lots of attention from candidates and pollsters.
Let’s have a look at some of the key issues from 2016 (I’ll split this across two posts to avoid this becoming too lengthy):
“The polls were completely wrong”
This is one of the main oversimplifications that is often trotted out as an explanation for 2016. First and foremost: the national polls were reasonably accurate – they predicted that Clinton would win the popular vote by a significant margin. What was not as accurate was the polling in some states which turned out to be decisive. These polls underrepresented the views of white working class voters in what is often called the ‘rust belt’ (Pennsylvania, Michigan and Wisconsin) Many of these voters went on to vote for Trump and enabled him to pick up 46 electoral votes (EV) with a combined margin of under 80,000 votes (significantly less that 1% of the total votes cast in these states). The polls for these states on election day were off by 4-6%, with each error favouring Trump. These errors were not huge by historical standards, however a 4.5% error can move a 4.2% Clinton lead to a 0.3% Trump victory.
The main factor that led to Trump’s victory being seen as such a ‘shock’ was the use of prediction models, combined with ‘conventional wisdom’. Many of the electoral models produced by newspapers, news networks and other sources predicted Clinton’s chance of victory somewhere north of 90%. This, combined with the polling error and the ‘conventional wisdom’ suggesting a politician like Trump could never win, led to a media narrative that was overly confident in predicting a Clinton win. The major exception to this was FiveThirtyEight, where analysts repeatedly stated that Trump was just a normal polling error behind Clinton. When reading polls this year make sure you don’t focus too much on one individual poll and consider what the poll would look like if a similar 5% error occurred. Also consider the percentages in predictive models such as the one at FiveThirtyEight.
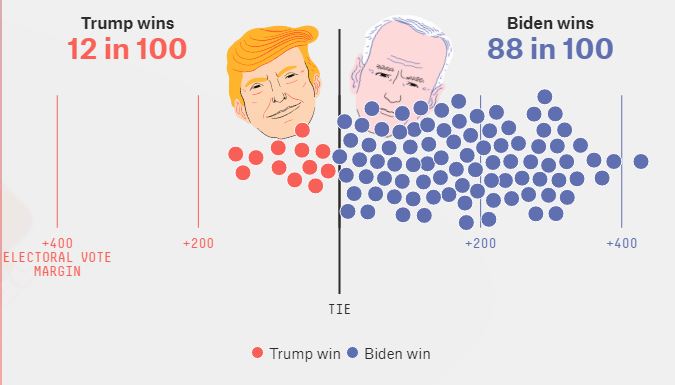
Although Trump is currently estimated to have a 12% chance of victory, this is only slightly less likely than you guessing what day a random date is (1 in 7 or about 14%).
‘Hold your nose’ voters
Many of those who voted for Trump were (and remain) phenomenally engaged by his policies and personality – we can consider this his ‘base’. We’ll explore these voters in tomorrow’s blog. There is also a similarly loyal group of Democrat voters. In the current US political environment, there are very few genuinely independent voters. This ‘hyper partisanship’ was mitigated in 2016 as voters had to choose between two of the most unpopular candidates ever on the ballot. This led to some very peculiar outcomes:
The first was a significant third party vote (whilst not as significant as 1992 (where independent Ross Perot won nearly 19% of the national vote), this was very significant in the rust belt states mentioned above) – mainly amongst Democrats. Young and more left-leaning Democrat voters, frustrated with the centrism, incrementalism and historical sleaze associated with Clinton, cast their vote for Jill Stein (the Green Party candidate).
The second was lower turnout amongst key voting blocs. Despite increased enthusiasm for the prospect of electing the first female president, turnout amongst women was not as high as expected and African-American turnout was significantly lower than in 2008 and 2012.
The third was the shift in voting pattern of white, working class voters without a degree. We’ll discuss this in greater detail tomorrow but, in short, this reliably Democratically leaning group gravitated to Trump en masse. This was not anticipated, as changes of this kind in elections usually occur over a longer period of time.
Thank you so much for reading this. Please feel free to leave your thoughts and ideas in the comments. Tomorrow I’ll run through the final few issues from 2016 and explore how these could influence the 2020 election.
